Debugging game logic
Defold contains an integrated Lua debugger with an inspection facility. Together with the built-in profiling tools it is a powerful tool that can help finding the cause of bugs in your game logic or help analyze performance issues.
Print and visual debugging
The simplest way to debug your game in Defold is to use print debugging. Use print() or pprint() statements to watch variables or indicate the flow of execution. If a game object without a script acts weird, you can just attach a script to it with the sole purpose of debugging. Using any of the printing functions will print to the Console view in the editor and to the game log.
In addition to printing, the engine can also draw debug text and straight lines on the screen. This is done by posting messages to the @render socket:
-- Draw value of "my_val" with debug text on the screen
msg.post("@render:", "draw_text", { text = "My value: " .. my_val, position = vmath.vector3(200, 200, 0) })

-- Draw colored text on the screen
local color_green = vmath.vector4(0, 1, 0, 1)
msg.post("@render:", "draw_debug_text", { text = "Custom color", position = vmath.vector3(200, 180, 0), color = color_green })

-- Draw debug line between player and enemy on the screen
local start_p = go.get_position("player")
local end_p = go.get_position("enemy")
local color_red = vmath.vector4(1, 0, 0, 1)
msg.post("@render:", "draw_line", { start_point = start_p, end_point = end_p, color = color_red })
The visual debug messages adds data to the rendering pipeline and is drawn as part of the regular render pipeline.
"draw_line"adds data that is rendered with therender.draw_debug3d()function in the render script."draw_text"is rendered with the/builtins/fonts/debug/always_on_top.fontthat uses the/builtins/fonts/debug/always_on_top_font.materialmaterial."draw_debug_text"is the same as"draw_text", but it’s rendered in a custom color.
Note that you probably want to update this data every frame so posting the messages in the update() function is a good idea.
Running the debugger
To run the debugger, select Debug ▸ Start/Attach which either starts up the game with the debugger attached or attaches the debugger to an already running game.
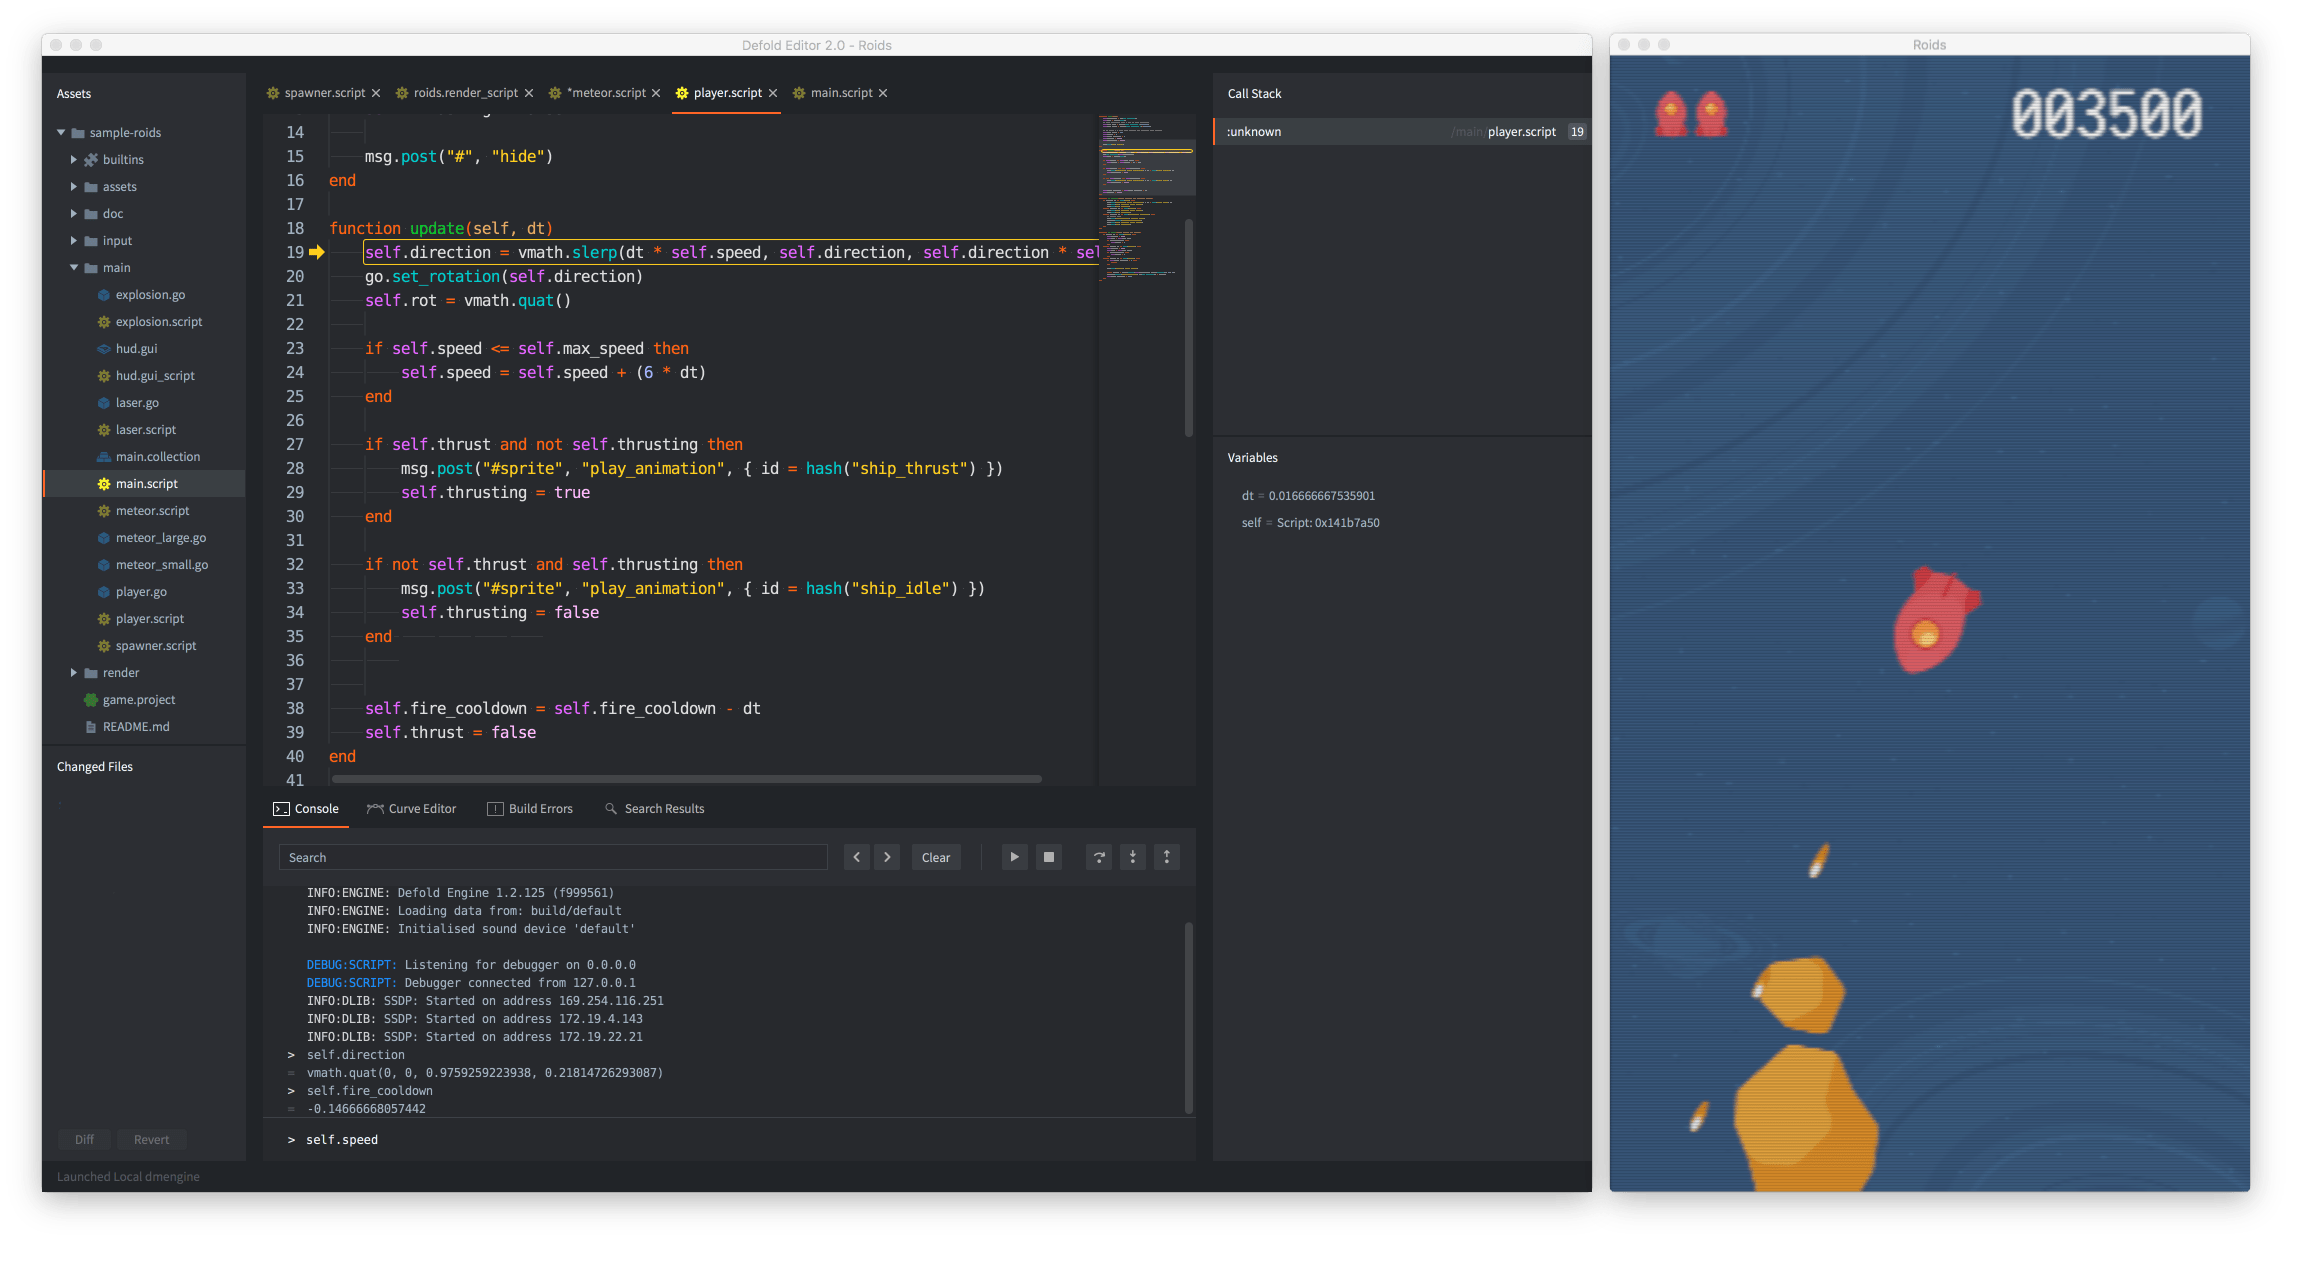
As soon as the debugger is attached, you have control of the execution of the game through the debugger control buttons in the console, or through the Debug menu:
- Break
Break execution of the game immediately. The game will break at its current point. You are now able to inspect the state of the game, advance the game step by step, or continue running it until the next breakpoint. The current point of execution is marked in the code editor:
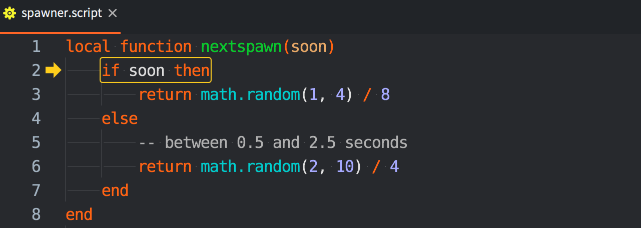
- Continue
Continue running the game. The game code will continue to run until you either press pause or the execution hits a breakpoint that you have set. If execution breaks at a set breakpoint, the the execution point is marked in the code editor on top of the breakpoint marker:

- Stop
Stop the debugger. Pressing this button will immediately stop the debugger, detach it from the game and terminate the running game.
- Step Over
Advance execution of the program one step. If the execution involves running another Lua function, the execution will not step into the function but continue running and stop on the next line below the function call. In this example, if the user presses “step over”, the debugger will execute code and stop at the
endstatement below the line with the call to the functionnextspawn():
A line of Lua code does not correspond to a single expression. Stepping in the debugger moves ahead one expression at a time, meaning that currently you may have to hit the step button more than once to advance to the next line.
- Step Into
Advance execution of the program one step. If the execution involves running another Lua function, the execution will step into the function. Calling the function adds an entry to the call stack. You can click each entry in the call stack list to view the entry point and the content of all variables in that closure. Here, the user has stepped into the function
nextspawn():
- Step Out
Continue execution until it returns from the current function. If you have stepped execution into a function, pressing the button “step out” will continue execution until the function returns.
- Setting and clearing breakpoints
- You can set an arbitrary number of breakpoints in your Lua code. When the game runs with the debugger attached, it will stop execution at the next breakpoint it encounters and wait for further interaction from you.
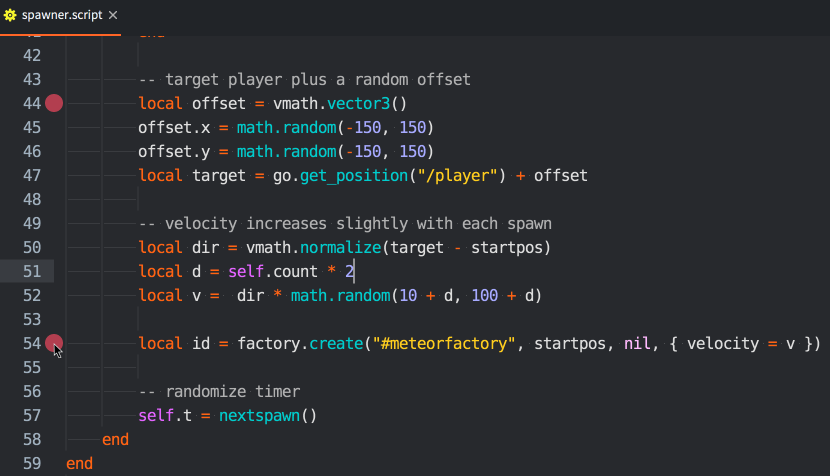
To set or clear a breakpoint, click in the column just right of the line numbers in the code editor. You can also select Edit ▸ Toggle Breakpoint from the menu.
- Setting conditional breakpoints
- You can configure your breakpoint to contain a condition that needs to evaluate to true for the breakpoint to trigger. The condition can access local variables available at the line during code execution.
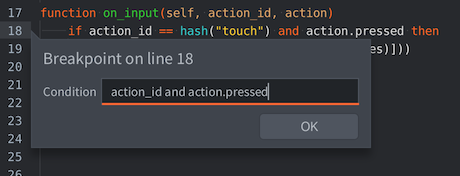
To edit the breakpoint condition, right-click in the column just right of the line numbers in the code editor, or select Edit ▸ Edit Breakpoint from the menu.
- Evaluating Lua expressions
- With the debugger attached and the game stopped at a breakpoint, a Lua runtime is available with the current context. Type Lua expressions in the bottom of the console and press Enter to evaluate them:
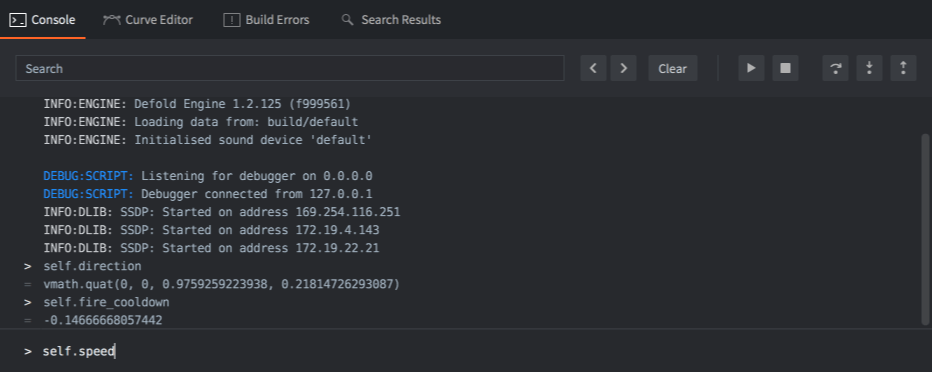
It is currently not possible to modify variables through the evaluator.
- Detaching the debugger
- Select Debug ▸ Detach Debugger to detach the debugger from the game. It will continue running immediately.
Lua debug library
Lua comes with a debug library that is useful in some situations, particularly if you need to inspect the innards of your Lua environment. You can find more information about it in the chapter about the Debug Library in the Lua manual.
Debugging checklist
If you encounter an error or if your game does not behave like expected, here is a debugging checklist:
-
Check the console output and verify that there are no runtime errors.
-
Add
printstatements to your code to verify that the code is actually running. -
If it’s not running, check that you have done the proper setup in the editor required for the code to run. Is the script added to the right game object? Have your script acquired input focus? Are the input-triggers correct? Is the shader code added to the material? Etc.
-
If your code is depending on the values of variables (in an if-statement, for example), either
printthose values where they are used or checked, or inspect them with the debugger.
Sometimes finding a bug can be a hard and time consuming process, requiring you to go through your code bit by bit, checking everything and narrowing down the faulty code and eliminating sources of error. This is best done by a method called “divide and conquer”:
- Figure out which half (or less) of the code that must contain the bug.
- Again, figure out which half, of that half, must contain the bug.
- Continue narrowing down the code that must cause the bug until you find it.
Happy hunting!
Debugging problems with physics
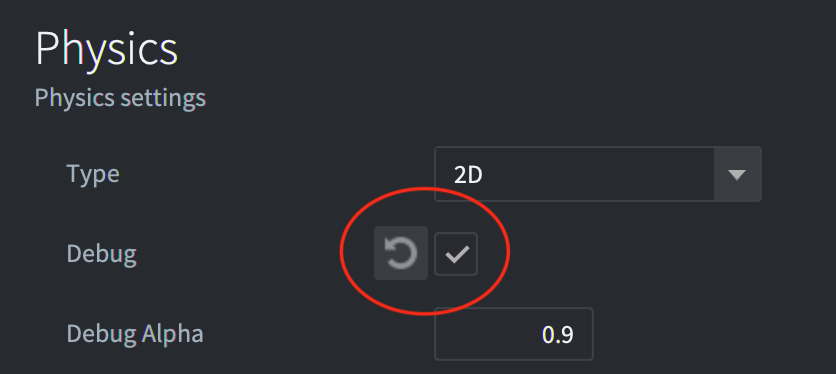
If you have problems with physics and collisions aren’t working as expected it is recommended to enable physics debugging. Check the Debug checkbox in the Physics section of the game.project file:
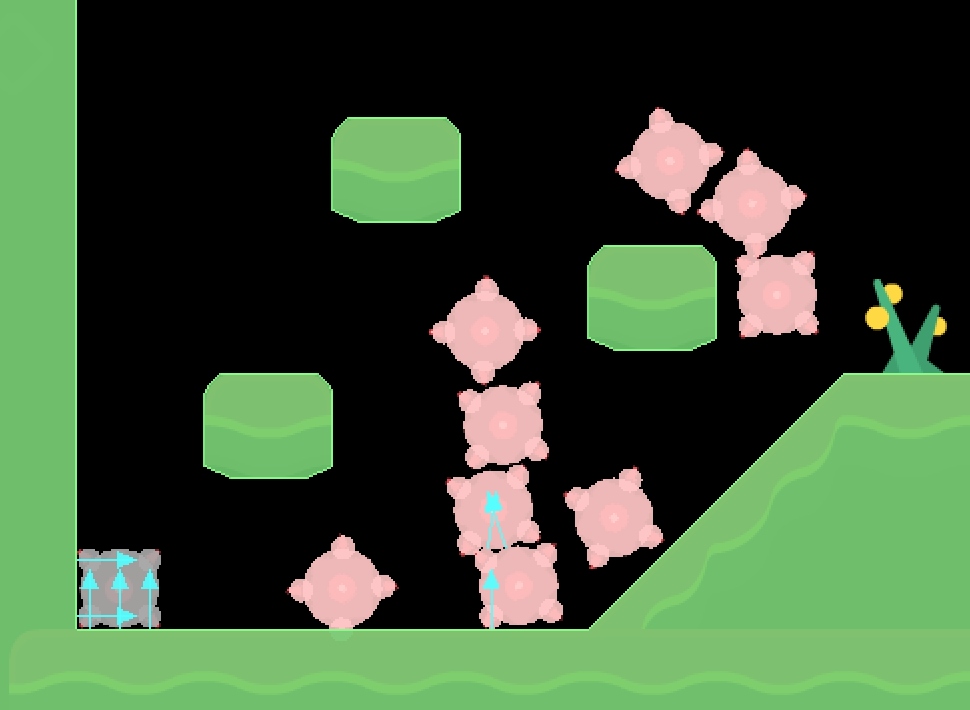
When this checkbox is enabled Defold will draw all collision shapes and contact points of collisions:
- Debugging game logic
- Print and visual debugging
- Running the debugger
- Lua debug library
- Debugging checklist
- Debugging problems with physics
- English
- 中文 (Chinese)
- Español (Spanish)
- Français (French)
- Νεοελληνική γλώσσα (Greek)
- Italiano (Italian)
- Język polski (Polish)
- Português (Portuguese)
- Русский (Russian)
- Українська (Ukranian)
Did you spot an error or do you have a suggestion? Please let us know on GitHub!
GITHUB