Game and system log
The game log shows all of the output from the engine, native extensions and your game logic. The print() and pprint() commands can be used from your scripts and Lua modules to show information in the game log. You can use the functions in the dmLog namespace to write to the game log from native extensions. The game log can be read from the editor, from a terminal window, using platform specific tools or from a log file.
System logs are generated by the operating system and it can provide additional information that can help you pinpoint a problem. The system logs can contain stack traces for crashes and low memory warnings.
Console/on-screen logging only shows information in Debug builds. In Release builds the console log is empty, but you can enable file logging in Release by setting the project setting “Write Log File” to “Always”. See details below.
Reading the game log from the editor
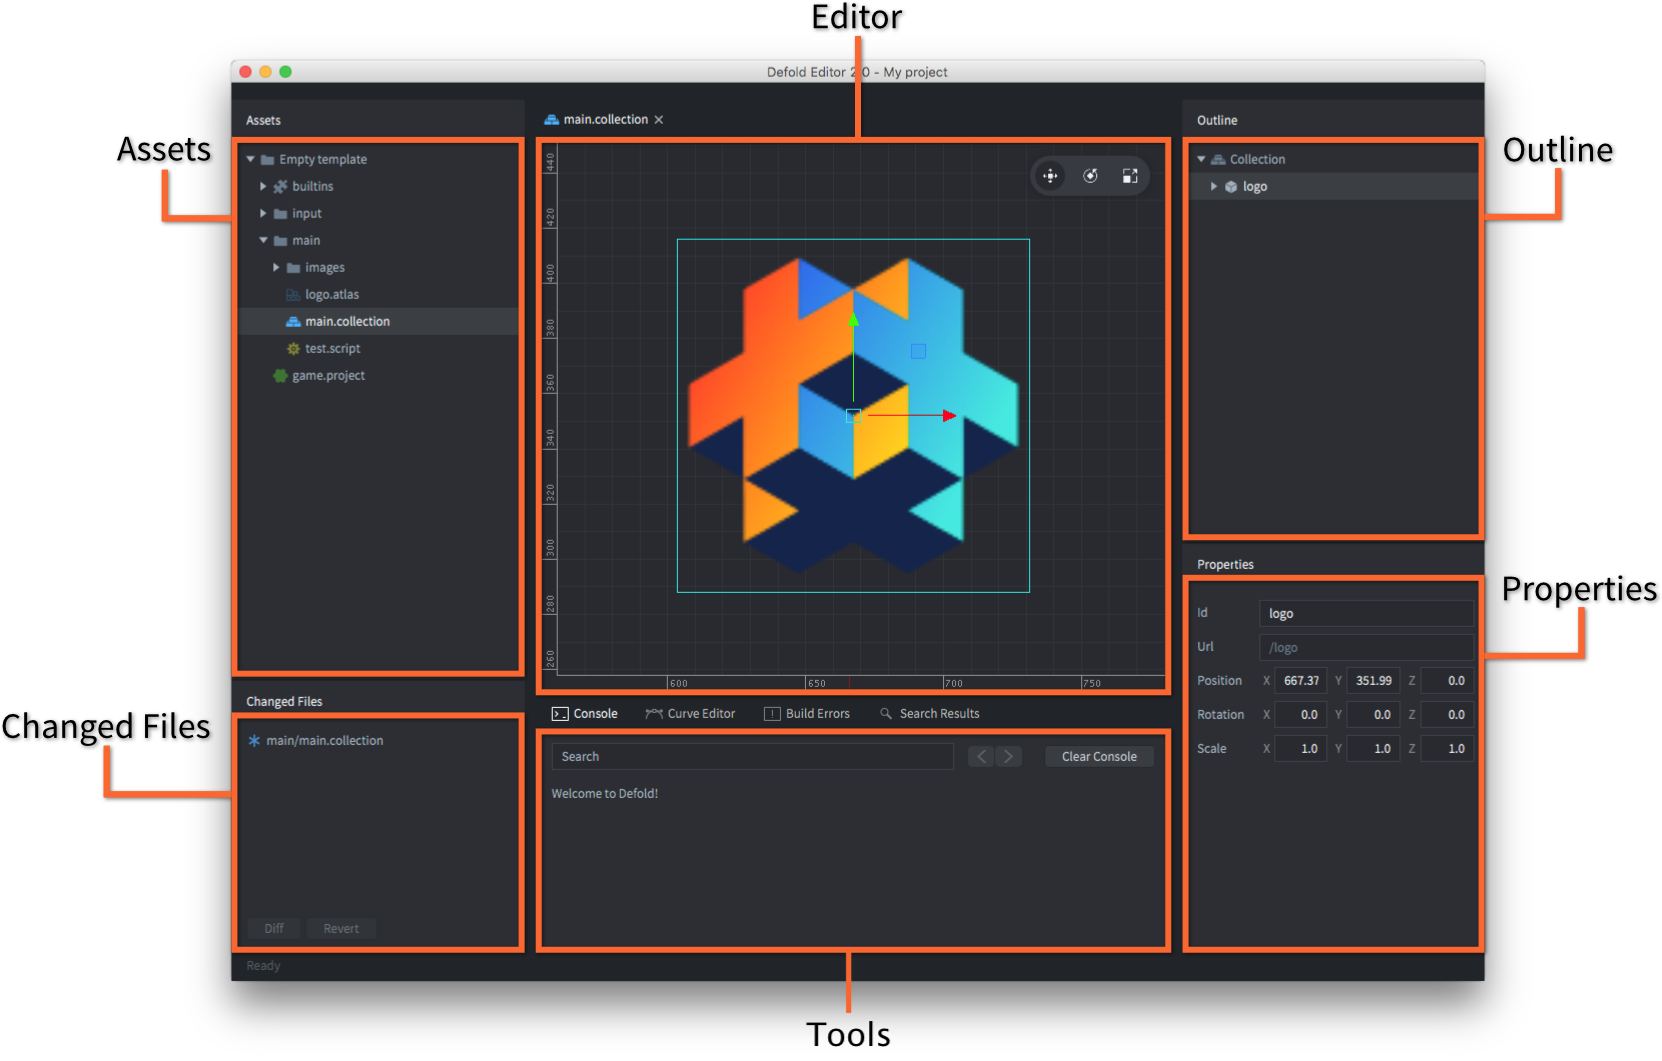
When you run your game locally from the editor or connected to the mobile development app all of the output will be shown in the console pane of the editor:

Reading the game log from the terminal
When you run a Defold game from the terminal the log will show in the terminal window itself. On Windows and Linux you type the name of the executable in the terminal to start the game. On macOS you need to launch the engine from within the .app file:
$ > ./mygame.app/Contents/MacOS/mygame
Reading game and system logs using platform specific tools
HTML5
Logs can be read using the developer tools provided by most browsers.
- Chrome - Menu > More Tools > Developer Tools
- Firefox - Tools > Web Developer > Web Console
- Edge
- Safari - Develop > Show JavaScript Console
Android
You can use the Android Debug Bridge (ADB) tool to view the game and system log.
The adb command line tool is an easy to use and versatile program that is used to interact with Android devices. You can download and install adb as part of the Android SDK Platform-Tools, for Mac, Linux or Windows.
Download the Android SDK Platform-Tools from: https://developer.android.com/studio/releases/platform-tools. You find the adb tool in /platform-tools/. Alternatively, platform specific packages can be installed through respective package managers.
On Ubuntu Linux:
$ sudo apt-get install android-tools-adb
On Fedora 18/19:
$ sudo yum install android-tools
On macOS (Homebrew)
$ brew cask install android-platform-tools
You can verify that adb works by connecting your Android device to your computer via USB and issue the following command:
$ adb devices
List of devices attached
31002535c90ef000    device
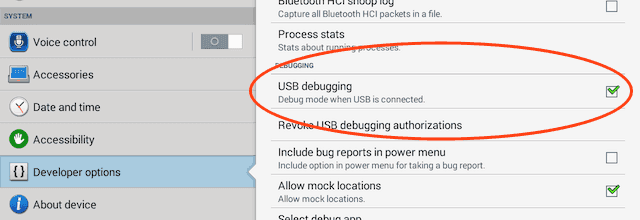
If your device does not show up, verify that you have enabled USB debugging on the Android device. Open the device Settings and look for Developer options (or Development).

Once installed and setup, connect your device with USB, open a terminal and run:
$ cd <path_to_android_sdk>/platform-tools/
$ adb logcat
The device will then dump all the output to the current terminal, along with any prints from the game.
If you want to see only Defold application outputs use this command:
$ cd <path_to_android_sdk>/platform-tools/
$ adb logcat -s defold
--------- beginning of /dev/log/system
--------- beginning of /dev/log/main
I/defold  ( 6210): INFO:DLIB: SSDP started (ssdp://192.168.0.97:58089, http://0.0.0.0:38637)
I/defold  ( 6210): INFO:ENGINE: Defold Engine 1.2.50 (8d1b912)
I/defold  ( 6210): INFO:ENGINE: Loading data from:
I/defold  ( 6210): INFO:ENGINE: Initialized sound device 'default'
I/defold  ( 6210):
D/defold  ( 6210): DEBUG:SCRIPT: Hello there, log!
...
iOS
You have multiple options to read game and system logs on iOS:
- You can use the Console tool to read game and system log.
- You can use the LLDB debugger to attach to a game running on device. To debug a game it needs to be signed with a “Apple Developer Provisioning Profile” that include the device you want to debug on. Bundle the game from the editor and supply the provisioning profile in the bundle dialog (bundling for iOS is only available on macOS).
To launch the game and attach the debugger you will need a tool called ios-deploy. Install and debug your game by running the following in a terminal:
$ ios-deploy --debug --bundle <path_to_game.app> # NOTE: not the .ipa file
This will install the app on your device, start it and automatically attach a LLDB debugger to it. If you are new to LLDB, read Getting Started with LLDB.
Reading the game log from the log file
Use the project setting “Write Log File” in game.project to control file logging:
- “Never”: Do not write a log file.
- “Debug”: Write a log file only for Debug builds.
- “Always”: Write a log file for both Debug and Release builds.
When enabled, any game output will be written to disk to a file named “log.txt”. Here is how you extract the file if you run the game on device:
- iOS
- Connect your device to a computer with macOS and Xcode installed.
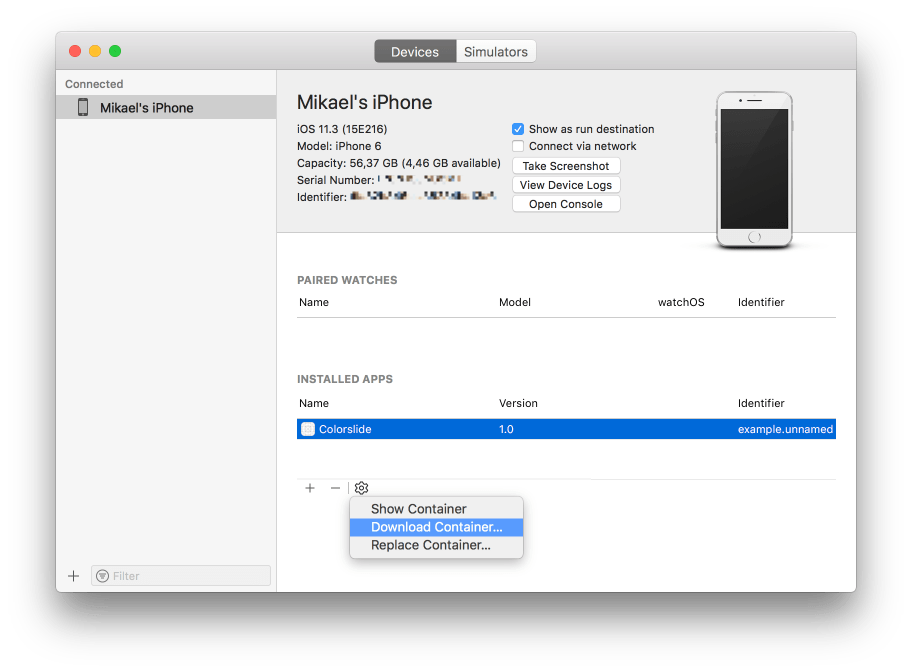
Open Xcode and go to Window ▸ Devices and Simulators.
Select your device in the list, then select the relevant app in the Installed Apps list.
Click the cog icon below the list and select Download Container....

Once the container has been extracted it will be shown in Finder. Right click the container and select Show Package Content. Locate the file “
log.txt”, which should be located in “AppData/Documents/”. - Android(
- The ability to extract the “
log.txt” depends on OS version and manufacturer. Here is a short and simple step by step guide.

